Forget sunshine and sandy beaches; Canada’s got a wilder side waiting to be explored. We’re talking about the land of misty mountains, thunderous waterfalls, and rain that falls like a symphony on moss-covered trees. This isn’t your grandma’s drizzle, folks; it’s an adventure for the senses, a baptism by a downpour that leaves you exhilarated and utterly soaked.
Think you’ve seen rain? Think again. We’re talking about places where annual precipitation makes other countries weep, where clouds hug the mountains like a wet wool blanket, and where rainbows are as common as maple syrup.
Exploring the 7 Rainiest Places in Canada
A Guide to Canada’s Wettest Destinations
1- Vancouver, British Columbia: The Rain Capital of Canada
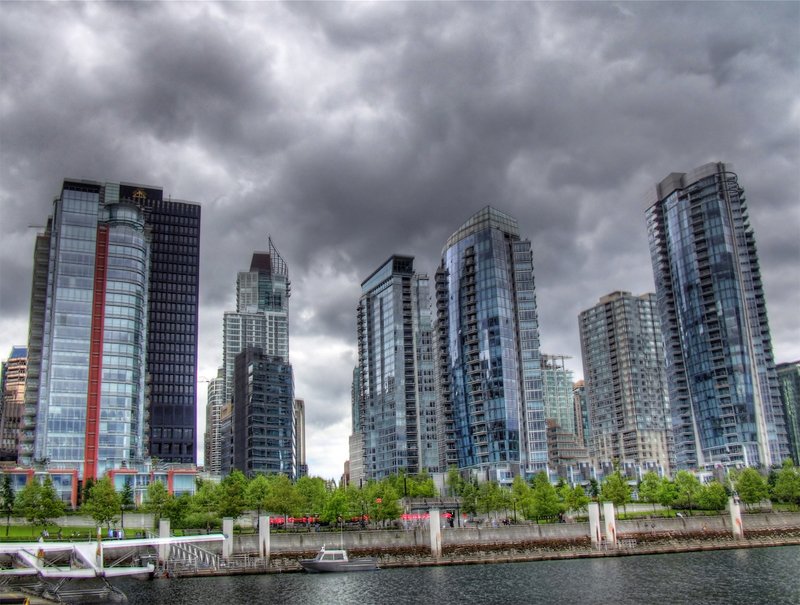
If you’re interested in Vancouver’s rainfall statistics, you’ll be glad that the city is well-known for its rainy weather. Vancouver experiences significant rainfall throughout the year, with certain months being stormy.
Vancouver’s rainfall statistics showcase a relatively high amount of precipitation compared to many other cities in Canada. Vancouver receives approximately 1,153 millimeters (45 inches) of rainfall annually. This consistent rain contributes to the region’s vibrant ecosystems and lush landscapes.
The city experiences a mild, rainy season from October to March. During this period, Vancouver receives the majority of its annual precipitation. The wettest months are November and December, when heavy rainfalls are common.
It is worth noting that rainfall distribution can vary from year to year. Some years may see above-average precipitation levels, while others may experience drier conditions. However, overall, Vancouver remains a relatively wet city throughout the year.

These rainfall figures are essential for locals and visitors, and they significantly impact many industries, such as urban planning, agriculture, and water management. Knowing the rainfall patterns in Vancouver aids in creating plans to reduce the risk of flooding and guarantee the sustainable use of water resources.
Vancouver is known for having a lot of precipitation, as evidenced by its rainfall statistics. Understanding Vancouver’s rainfall trends can be helpful when making investment decisions in weather-sensitive sectors or organizing outdoor activities.
2- Tofino, British Columbia

Tofino, located on the coast and near the Pacific Ocean, receives significant yearly rainfall. The town averages about 3,500 millimeters (138 inches) of rainfall annually.
The rainy season in Tofino usually starts in October and lasts until March or April. During this time, there are frequent rain showers and cloudy weather. The wettest months are generally November and December, when the precipitation levels are at their highest.
It is worth noting, however, that the amount of rainfall in Tofino can vary each year. Some years may have more precipitation than others, while some may have drier conditions. It’s a good idea to watch current weather forecasts and historical data to know what to expect during your visit to Tofino.
Whether you’re planning outdoor activities or just want to be prepared for the weather during your stay in Tofino, knowing the rainfall statistics can help you make informed decisions and ensure a pleasant experience in this beautiful coastal town.
Forget drizzle, we’re talking annual precipitation that makes other countries weep! This is a baptism by downpour, an exhilarating symphony on moss-covered rooftops. So grab your raincoat, your inner explorer, and get ready to get soaked in wonder!
3- Prince Rupert, British Columbia
Prince Rupert is a city located in British Columbia, Canada, that is notable for its distinctive climate and high levels of rainfall. This section will delve into Prince Rupert’s rainfall data to better understand its weather patterns.
Due to its location within the Coastal Mountains and proximity to the Pacific Ocean, Prince Rupert receives a significant amount of precipitation throughout the year, making it one of the wettest cities in Canada. The city experiences 2,400 millimeters (94 inches) of rainfall annually, equivalent to 200 millimeters (8 inches) per month. The rainiest months are typically from October to February, during which the city experiences heavy rain showers and frequent drizzles.
The rainy climate of Prince Rupert plays a crucial role in shaping its lush green landscapes and diverse flora and fauna. It also creates ideal conditions for various industries, such as forestry and aquaculture.
Understanding the rainfall statistics of Prince Rupert is vital for residents, tourists, and businesses. It helps with planning outdoor activities, assessing water resources availability, and predicting potential environmental impacts.
4- Haida Gwaii (Queen Charlotte Islands), British Columbia

Haida Gwaii, formerly known as the Queen Charlotte Islands, is an archipelago located off the coast of British Columbia, Canada. Known for its stunning natural beauty and rich cultural heritage, Haida Gwaii is renowned for its unique climate and rainfall patterns.
Regarding rainfall statistics, Haida Gwaii experiences significant precipitation throughout the year. The islands are known for their lush rainforests and abundant wildlife, which thrive due to the ample rainfall they receive.
According to historical data, Haida Gwaii receives an average annual rainfall of approximately 2,500 millimeters (98 inches). This high level of precipitation can be attributed to several factors, including its coastal location and proximity to Pacific weather systems. The region’s geography and topography also play a role in creating a favorable environment for increased rainfall.
The consistent rainfall on Haida Gwaii contributes to the growth of diverse plant species and supports a thriving ecosystem. It also provides essential water resources for local communities and sustains the island’s vibrant natural landscapes.
These unique rainfall statistics make Haida Gwaii an ideal destination for nature enthusiasts and those seeking to immerse themselves in a pristine wilderness setting. Whether you’re exploring ancient forests or observing marine life along its rugged coastline, Haida Gwaii offers an unforgettable experience shaped by its abundant rainfall.
Think beyond sun-kissed beaches, because Canada’s wild side craves downpours! Here, clouds hug mountains like wet wool blankets, forests pulsate with emerald life, and every raindrop is a drumbeat calling you to the dance.
5- Cranbrook, British Columbia
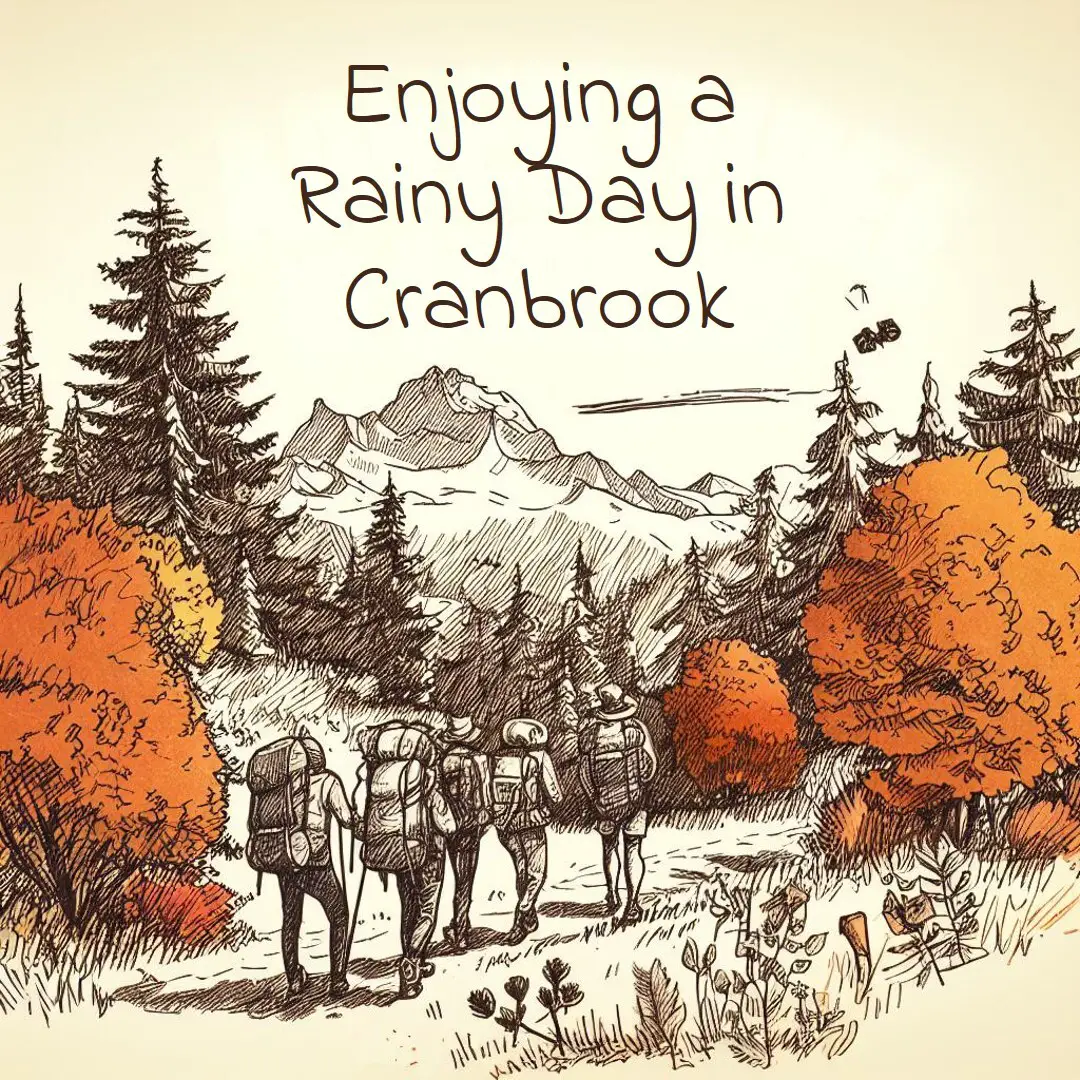
Cranbrook is a city located in British Columbia, Canada, and it experiences varying levels of rainfall throughout the year. Rainfall statistics provide valuable insights into precipitation patterns and can be helpful for various purposes such as urban planning, agriculture, water resource management, and meteorological research.
The rainfall distribution across different seasons is also crucial in understanding Cranbrook’s climate. During the summer months (June to August), Cranbrook typically receives less rainfall than other seasons. On the other hand, the fall and spring seasons often experience higher precipitation levels.
Analyzing long-term trends in Cranbrook’s rainfall statistics can help identify potential changes or anomalies in the local climate patterns. This information is precious for assessing climate change impacts on water resources and developing strategies for sustainable water management.
It is worth mentioning that accurate and up-to-date rainfall data is collected by meteorological stations located within or around Cranbrook. These stations use advanced instruments and techniques to measure precipitation accurately, ensuring reliable data for research and decision-making purposes.
Overall, understanding Cranbrook’s rainfall statistics provides a comprehensive overview of its climatic conditions and helps inform various sectors about water availability and potential impacts on the local environment.
6- Sydney (Cape Breton Island), Nova Scotia

Sydney typically receives an average annual rainfall of about 1,600 millimeters (63 inches), making it one of the wettest areas in Nova Scotia. The rain is distributed evenly across the months, with no distinct dry season. However, certain months tend to be slightly wetter than others.
During the summer months of June, July, and August, the area experiences the highest rainfall, with an average monthly precipitation ranging between 100-120 millimeters (4-5 inches). This is due to increased humidity and occasional thunderstorms during this time.
On the other hand, the winter months experience lower levels of precipitation. December and January are generally the driest months, with an average monthly rainfall of around 80 millimeters (3 inches).
It’s important to note that these statistics are based on averages and can vary from year to year. The localized weather patterns and climate change can influence rainfall amounts in specific seasons or years.
Understanding the rainfall statistics of Sydney is significant in various sectors, such as agriculture, water management, and urban planning. It helps residents and businesses prepare for potential weather-related challenges and make informed decisions regarding water usage and conservation efforts.
7- St. John’s, Newfoundland and Labrador

St. John’s city receives a significant amount of rainfall throughout the year. The town experiences approximately 1,500 millimeters (59 inches) of precipitation annually, including rain and snowfall. The rainfall is distributed consistently throughout the year, with slightly higher precipitation levels during the fall and winter. The wettest months are usually October through December, with an average monthly rainfall of over 150 millimeters (6 inches).
These rainfall statistics are crucial in various sectors, such as agriculture, construction, and urban planning. Farmers depend on this information to determine crop watering needs, while construction companies consider it when scheduling outdoor projects. Meteorologists and climate scientists analyze these statistics to study long-term weather trends and assess the potential effects of climate change on local precipitation patterns.
Comprehending St. John’s rainfall statistics provides valuable knowledge about the city’s climate dynamics and aids in making informed decisions related to various industries that rely on precise weather data.
How much rain does Canada get a year?

Canada, the land of maple syrup and snow-capped mountains, might surprise you with its diverse precipitation patterns. It’s not all icy winters and bone-dry summers! While the national average rainfall hovers around 533 mm (21 inches) per year, that number hides a fascinating story of regional extremes.
West Coast Warriors: Step into British Columbia and prepare for a soaking good time! Coastal cities like Prince Rupert average a whopping 2,594 mm (102 inches) annually, making them true rain champions. Think lush rainforests, cascading waterfalls, and moss-covered everything! On Vancouver Island, you’ll still encounter a respectable 1,100 mm (43 inches), perfect for cozy cabin retreats and misty hikes.
Prairie Patchwork: The central plains tell a different tale. Winnipeg, for example, enjoys a more moderate 540 mm (21 inches), with most falling in summer. This creates rich farmland and stunning wildflower meadows when the sun finally peeks through.
East Coast Eddies: Moving east, Atlantic provinces like Newfoundland and Nova Scotia experience a maritime climate with annual totals close to 1,000 mm (39 inches). Think dramatic coastlines sculpted by rain, wind-whipped storms, and cozy pubs where locals swap stories of the salty sea.
Northern Mysteries: Up north, things get intriguing. The Arctic tundra receives as little as 200 mm (8 inches) annually, thanks to cold temperatures and permafrost. Yet, the snow melt creates unique wetlands and vibrant ecosystems adapted to a drier world.
So, Canada’s rain dances to a vibrant tune! Each region paints a unique picture with its watercolors, from rainforest torrents to gentle prairie showers. Next time you think of Canada, remember it’s not just about the cold—it’s about the diversity and the stories woven with every drop that falls.
Why is Vancouver called a rain city?
Vancouver, a city in Canada’s westernmost province, is known as “Rain City” due to its heavy rainfall and unique climate. The town is situated between the Pacific Ocean and the Coastal Mountain Range, creating an ideal environment for moisture-laden air masses to collide with mountainous terrain.
Vancouver receives an average of 1,153 millimeters of precipitation annually, with the wettest months being November through February. This rainfall has shaped Vancouver’s lush green landscapes and thriving ecosystems, making it a popular destination for outdoor activities. Despite its rainy weather, it sustains the region’s diverse flora and fauna, adding to its charm.
Where does it rain in Canada?
Canada’s precipitation levels vary across its regions, with British Columbia and the Atlantic provinces on the east coast experiencing higher rainfall levels due to their combination of oceanic influences and mountainous terrain. However, rainfall patterns can vary within each province and territory, influenced by elevation, proximity to water bodies, and local weather systems. Overall, rain is common in many parts of Canada.
Why is Vancouver so rainy?
Vancouver, on Canada’s west coast, is known for its high rainfall. Moist air from the Pacific collides with coastal mountains, cools, and causes rain. Prevailing westerly winds bring moisture-laden air towards Vancouver. The region’s location in a temperate rainforest zone enhances its rainy reputation. Vancouver gets substantial precipitation but doesn’t rain daily, with higher amounts in fall and winter.
Conclusion:
A unique charm can be found in embracing the rain regarding Canadian destinations. Instead of letting gloomy weather dampen your spirits, you can truly appreciate nature’s wet beauty in all its glory. From misty forests to glistening lakes, the rain adds an enchanting element to the landscape.
Moreover, outdoor activities in the rain offer a whole new set of experiences and adventures. Rainy days provide the perfect opportunity to explore lush hiking trails that come alive with vibrant colors and fragrant scents. The sound of raindrops on leaves creates a soothing ambiance as you immerse yourself in the natural surroundings.
For those seeking thrills, various water-based activities become even more exhilarating under rainy conditions. From kayaking through rushing rivers to indulging in white-water rafting adventures, Canada offers endless opportunities for outdoor enthusiasts to embrace their adventurous side. Not only does embracing the rain allow you to connect with nature on a deeper level, but it also gives you a chance to witness Canada’s breathtaking landscapes from a unique perspective.
So, next time you find yourself amidst rainfall in one of Canada’s stunning destinations, seize the opportunity and let nature’s wet beauty captivate your senses as you embark on unforgettable outdoor escapades.
- Yonge-Dundas Square in Toronto is Now Called “Sankofa Square” - December 17, 2023
- Best Western Brooks’ SureStay Plus debuts in Alberta - December 16, 2023
- Air Canada Arrives in Tulum, Mexico as the First Canadian Airline - December 16, 2023


